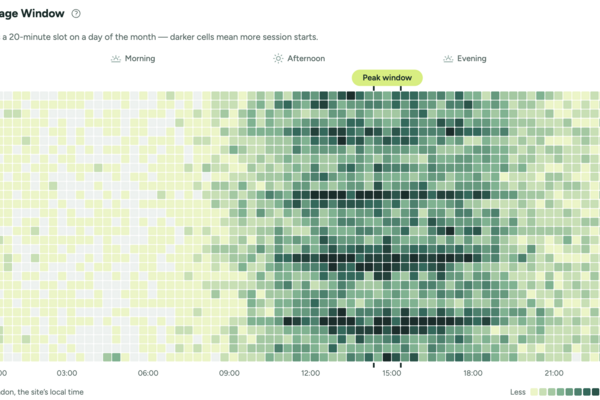
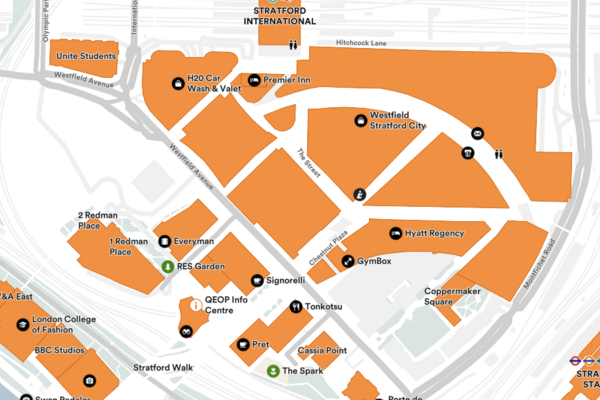
What visitor data does a digital map give a shopping centre, and how is it different from footfall counting?
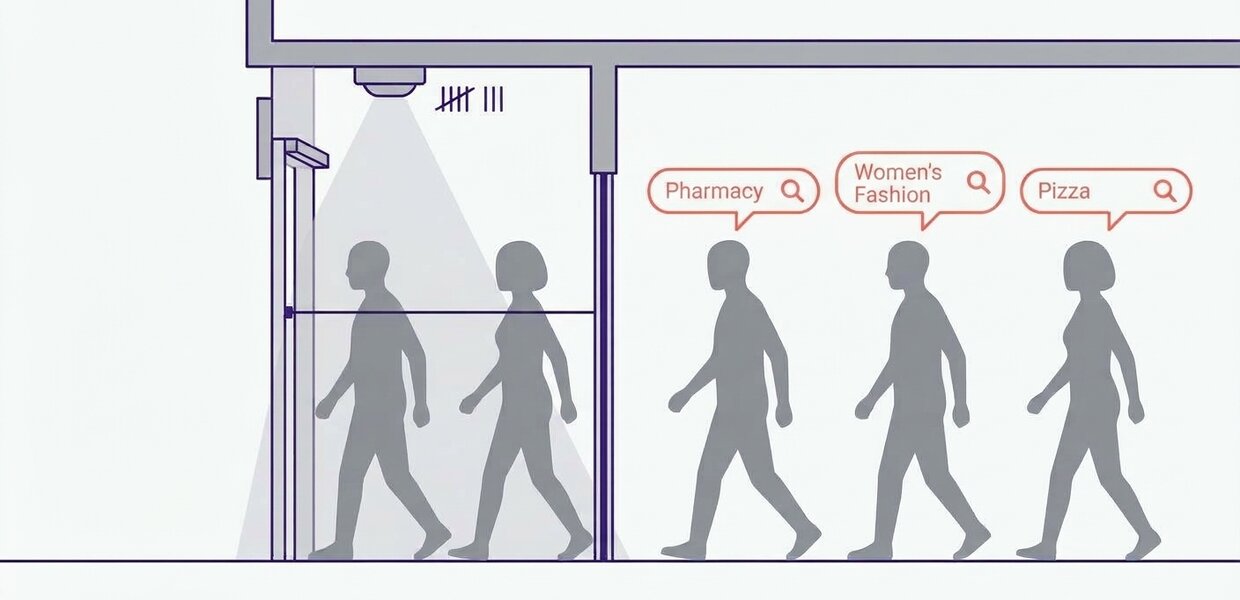

Footfall counting tells you how many people came into the centre. A digital map's analytics show what visitors searched for on the map, in their own words. Living Map collects no personal data; usage analytics are anonymous.
Used together, the two give a fuller picture: how busy the centre was, and what people were trying to find while they were there.
What's the difference between intent and headcount?
A footfall report might show that Saturday was busy. It won't show why people came, or whether they found what they were looking for.
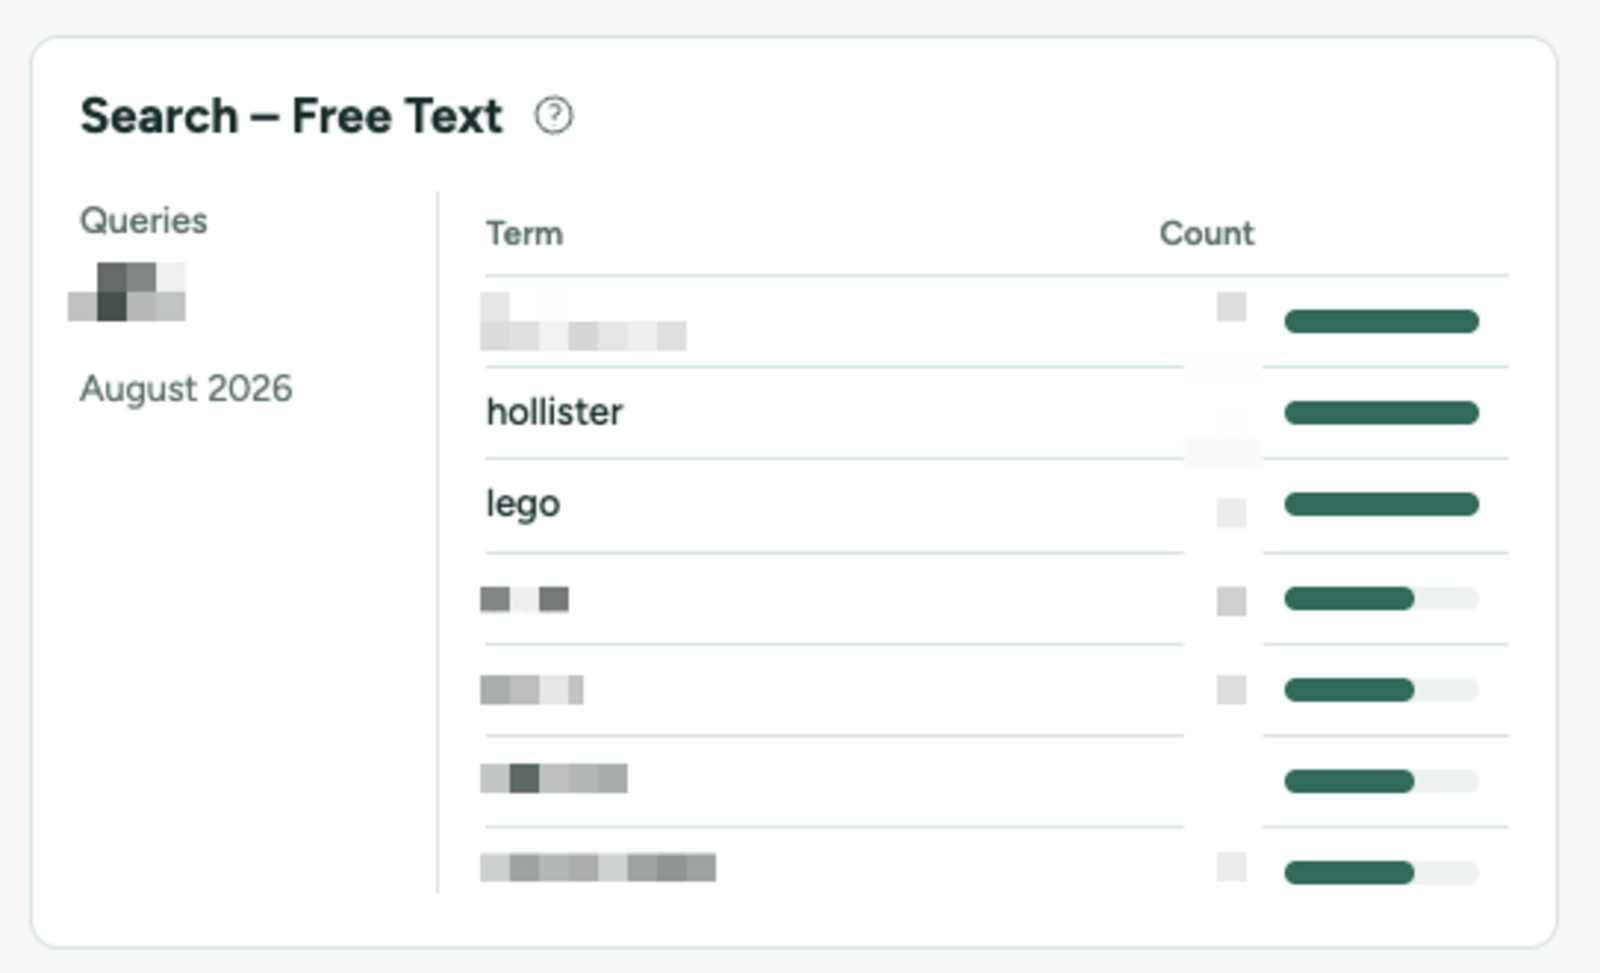
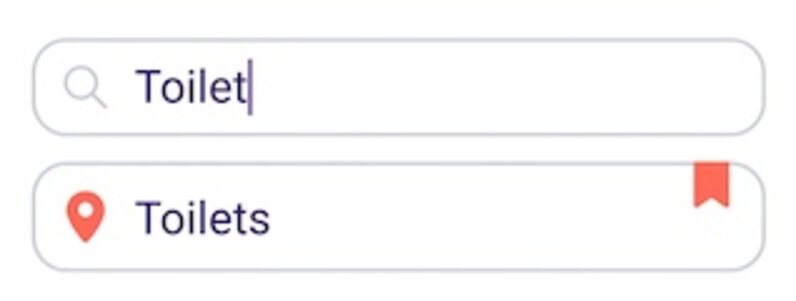
Map searches are a record of what visitors wanted, typed in their own words. As general examples of what a team might see (not data from any particular centre):
- a rise in searches for gifts or a grotto as Christmas approaches
- regular searches for a facility, such as a parent room or a cash machine
- searches for a type of shop the centre doesn't currently have
None of these tells you who searched. Each tells you something about what people came for that a headcount can't.
What is and isn't collected?
Living Map collects no personal data; usage analytics are anonymous. Visitors don't download an app; the map opens in their phone's browser. The blue dot, which shows visitors where they are, uses the phone's own location in the browser and can be switched off for any client that prefers.
There's more on this in our FAQ on what data a digital wayfinding map collects about visitors.
What do teams do with the data?
Different teams tend to look for different things in the same search data:
- Facilities can see which facilities people look for most, and whether they're easy enough to find on the map and in the building. Analysing the data on the different screens in the location can help identify spots where signage may need improving and/or facilities investing in.
- Leasing and asset management can see what kinds of shops and services visitors are looking for, alongside the centre's existing tenant mix. This data can help companies market certain locations in the centres.
- Marketing can see what's on visitors' minds at different times of year, and plan campaigns and events around it.
Trafford Centre in Manchester names data insight as one of the benefits of its map. In the Trafford Centre case study, Gemma Ward, Head of Marketing, Trafford Centre, said: “As a super-regional shopping and leisure destination, we wanted to improve the wayfinding experience for our visitors, so we partnered with Living Map to roll out 10 digital wayfinding screens in high-traffic areas. The upgrade allows us to quickly implement changes, enhance guest experience, and use data insights to understand customer preferences. Living Map have delivered the product to a high standard, we love the fact that the product is continuously developing and evolving which enables us to offer our customers an innovative mall map with new features.”
Does this replace footfall counting?
No. Footfall counting answers a different question, and the two work best together. Footfall shows how many people came and when. Map searches add what those people were looking for.
To see how the analytics are presented, visit the Analytics Dashboard page. If you'd like to talk about what map data could tell you about your centre, happy to talk it through.
Request a demo
Experience the power of our mapping, wayfinding, and asset tracking technology for yourself. See how our software can enhance your facility.