Static Asset Visualisation: Putting Your Infrastructure on the Map

Every complex building contains hundreds — sometimes thousands — of static assets that keep it running: security cameras, air quality sensors, fire extinguishers, clinical waste bins, wifi access points, AEDs, electrical switchgear. These assets are essential to operations, compliance, and safety. But in most organisations, knowledge of where they are and what condition they're in lives in spreadsheets, legacy systems, or people's heads.
That's a problem when you need to act quickly — whether it's responding to an incident, planning maintenance, or simply answering the question: where is the nearest one?
Living Map's Static Asset Visualisation brings all of this onto a single, interactive digital map — giving estates teams, facilities managers, and operational staff a clear, visual picture of their infrastructure without having to walk the building or dig through records.
What it actually does
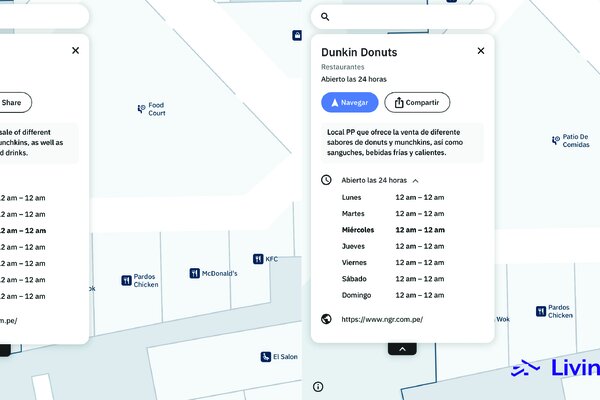
At its simplest, asset visualisation places your static infrastructure onto a Living Map floor plan. Each asset is represented as a pin on the map, positioned precisely where it sits in the real world. Tap or click on any asset and you can see contextual detail: what it is, when it was last serviced, photos, notes, ownership, and any other metadata your team needs.
But the real value comes when this map layer connects to your live building systems.
Connecting to real-time data
Where assets are connected to IoT sensors or building management systems, Living Map can pull through live operational data and display it visually on the map. This turns a static floor plan into something closer to a live control panel. A few examples of how this works in practice:
Air quality monitoring — Rather than checking a separate dashboard or waiting for an alert, estates teams can see air quality readings overlaid directly onto the floor plan. Areas showing normal readings appear in one colour; areas that need attention stand out immediately. This is particularly useful in healthcare settings, where air quality can be a clinical concern, and in education, where ventilation has become a priority since the pandemic.
Clinical waste management — Hospitals and care facilities deal with strict regulations around clinical waste. By connecting fill-level sensors in clinical waste bins to the map, facilities teams can see at a glance which bins need emptying, plan collection routes more efficiently, and maintain audit-ready records — rather than relying on fixed schedules that may not reflect actual usage.
Security camera coverage — Placing camera locations onto the map gives security teams an immediate understanding of what's covered and where blind spots might exist. When paired with camera status data, it also flags which cameras are offline or need maintenance — something that typically only surfaces when footage is needed and isn't there.
These are just starting points. The same approach works for any static asset where location and status matter — from fire safety equipment to EV charging points to medical devices.
Why a map, not a database?
Most organisations already have asset registers. The issue isn't usually a lack of data — it's that the data is disconnected from the physical space it relates to. A spreadsheet can tell you that Camera 47 was last serviced in January. It can't tell you that Camera 47 is the one covering the east corridor on level 3 — at least, not in a way that's useful in the moment.
A map changes that. It provides spatial context that makes data immediately understandable, even to someone who's never been in the building before. That's especially valuable for new staff, contractors, emergency responders, or anyone managing a portfolio of sites they can't visit every day.
How it fits into the Living Map platform
Static Asset Visualisation is a layer within the broader Living Map Platform. That means it sits alongside — and works with — our wayfinding, routing, and analytics tools. For example, you could use the same platform to help visitors navigate to their appointment and to help your estates team locate and manage the infrastructure behind the scenes. One map, two very different audiences, both getting what they need.
The Living Map Platform is a SaaS solution, managed through our Map Manager System, which means your team can update asset positions, add new assets, and edit information without needing to contact us or write any code. Changes go live immediately.
Where this is being used
Asset visualisation is already in use across several of the sectors we work in. In healthcare, it helps hospitals manage clinical equipment and compliance-critical infrastructure across large, complex hospital estates. In retail, shopping centre operators use it to keep track of everything from CCTV coverage to energy infrastructure across multi-floor environments. In transport, it supports operational teams managing assets across terminals and stations.
If you're responsible for managing the built environment — and you'd like to see what your infrastructure looks like on a Living Map — we'd welcome a conversation.
Book a demo to see it in action with your own floor plans.
Request a demo
Experience the power of our mapping, wayfinding, and asset tracking technology for yourself. See how our software can enhance your facility.